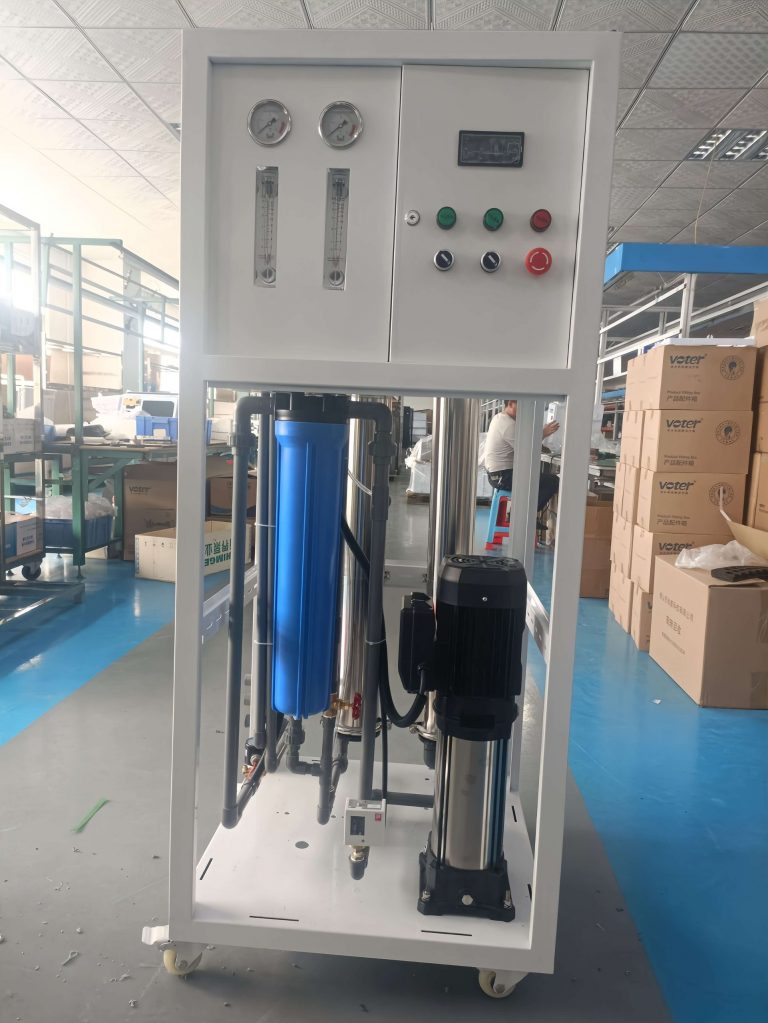
Why OPEX Matters More Than CAPEX
When evaluating a seawater desalination project, many buyers focus primarily on the initial capital expenditure—the price of the equipment itself. But here’s the reality: over the 20- to 25-year lifespan of a desalination plant, operating expenditure (OPEX) typically dominates total lifecycle costs —often by a wide margin.
For seawater reverse osmosis systems, the single largest component of OPEX is energy consumption, accounting for 40% to 60% of total operating costs in many plants. Beyond energy, there are membrane replacement costs, chemical consumption, routine maintenance, labor, and brine management. Add them up, and OPEX can easily outstrip the initial purchase price within just a few years of operation.
This guide is written for exactly the kind of customer you serve: project developers, engineering firms, industrial operators, and government buyers who need real, actionable strategies to bring down the ongoing cost of desalinated water—without compromising quality or reliability.
We are a direct factory supplier of seawater desalination units, covering capacities from 3 tons per day all the way up to 1,000 tons per day and beyond. We have spent years helping clients across Southeast Asia, the Middle East, Africa, and island nations optimize their operating costs. Below, we share what actually works.
We will cover seven proven strategies for reducing seawater desalination operating costs, including technology upgrades, operational best practices, and smart procurement choices. Each strategy comes with real-world data on expected savings.
Understanding the True Cost of Desalination
Before we talk about cutting costs, let’s get clear on where your money actually goes.
For a typical seawater reverse osmosis (SWRO) plant, the operating expenditure breakdown looks like this:
| Cost Component | Typical Share of Total OPEX | Key Drivers |
|---|---|---|
| Energy / Electricity | 40%–60% | High-pressure pumps, feedwater salinity, recovery rate, ERD efficiency |
| Membrane Replacement | 15%–25% | Membrane lifespan (typically 3–5 years), fouling frequency, cleaning practices |
| Chemicals (antiscalants, cleaning agents, biocides) | 8%–15% | Feedwater quality, dosing accuracy, chemical type |
| Labor & Maintenance | 10%–15% | Staffing, preventive maintenance scheduling, spare parts inventory |
| Brine Disposal & Environmental Compliance | 2%–5% | Discharge regulations, monitoring requirements |
Understanding this breakdown helps you prioritize. If energy accounts for half of your OPEX, then even a 20% reduction in energy consumption yields a 10% overall cost reduction. Small improvements in the right areas compound into major savings.
Strategy #1 — Energy Recovery Devices (ERDs)
The single most effective way to reduce seawater desalination operating costs is to install a high-efficiency energy recovery device.
How It Works
In a reverse osmosis system, seawater is pressurized to overcome osmotic pressure and push water molecules through the membrane. The pressurized concentrate (brine) stream that leaves the membrane vessel still contains 95% or more of that high-pressure energy. Without energy recovery, that energy is simply thrown away.
An energy recovery device captures that waste pressure energy from the brine stream and transfers it back to the incoming feedwater, dramatically reducing the work required from the high-pressure pump. This simple mechanism cuts net energy consumption without reducing freshwater output.
What the Data Shows
Modern isobaric energy recovery devices—such as pressure exchangers—routinely achieve 97–99% efficiency in recovering waste pressure energy. The results are striking:
-
Specific energy consumption can drop from over 7 kWh per cubic meter (no ERD) to as low as 3.8 kWh/m³ with a properly sized ERD system.
-
The best-in-class SWRO plants have achieved Specific Energy Consumption (SEC) below 2.0 kWh/m³ by combining high-efficiency ERDs with optimized high-pressure pumps.
-
Energy consumption can be cut by up to 60% compared to systems without energy recovery.
-
A 30-year design life with no scheduled maintenance is standard for high-quality ceramic pressure exchangers.
Practical Sizing Guidance for Factory Direct Customers
For your target capacities (3 to 1,000+ tons per day), the ERD sizing breaks down as follows:
-
3–10 tons/day (small-scale) : For very small units, the CAPEX of an ERD may not pay back quickly unless energy prices are high (above $0.15/kWh). For most small systems, a high-efficiency pump alone is more cost-effective. However, if the plant will run 24/7 in a high-energy-cost region, a compact rotary ERD can still deliver sub-4 kWh/m³ performance.
-
10–100 tons/day (mid-scale) : This is where ERD economics become highly favorable. Payback period typically ranges from 1 to 3 years, depending on local electricity rates and annual operating hours.
-
100–1,000+ tons/day (large-scale) : ERD is considered mandatory in modern SWRO plants at this scale. Large-scale projects without ERD are virtually unheard of today—energy costs would make the project economically unviable.
For our factory direct customers, we can integrate ERDs into any unit above 10 tons/day, with device sourcing from leading manufacturers, optimizing the balance between CAPEX and OPEX based on your specific energy costs and production targets.
Low-Energy SWRO Membranes
Energy recovery devices get most of the attention, but the membranes themselves are the second major lever for reducing specific energy consumption.
The Technology Shift
Over the past decade, membrane manufacturers have made significant advances in low-energy membrane chemistry. Modern seawater RO membranes are designed to achieve the same salt rejection at significantly lower transmembrane pressure than older-generation products.
The key innovation is membrane surface modification and thinner, more permeable polyamide active layers. These changes reduce hydraulic resistance while maintaining high rejection of dissolved salts. Additionally, research teams are developing ultra-efficient membranes that could further reduce the cost and energy requirements of freshwater production.
Real-World Impact
-
Substituting older SWRO membranes with current-generation low-energy membranes can reduce SEC by 0.5–1.0 kWh/m³—typically a 10–20% reduction in energy OPEX.
-
When combined with an optimized ERD and high-efficiency pumps, low-energy membranes enable plants to achieve SEC in the 1.8–2.5 kWh/m³ range—an efficiency level that was unattainable just a decade ago.
-
For a 100-ton/day plant running 300 days/year at 0.12/kWh∗∗:A0.8kWh/m3reductionsavesroughly0.12/kWh∗∗:A0.8kWh/m3reductionsavesroughly2,900 annually without any other changes.
Membrane lifespan and cost trade-offs
Lower operating pressure generally translates into slower membrane degradation over time. However, low-energy membranes may come at a slight premium in upfront cost. The key is to run a simple lifecycle cost analysis comparing CAPEX versus annual energy savings.
As a factory direct supplier, we can offer customers a choice between standard-performance and low-energy membrane configurations. For most projects—especially those in high-energy-cost regions or with 24/7 operation—the low-energy option pays for itself within 12–24 months
Strategy #3 — Operational Scheduling (Run When Power Is Cheapest)
One of the lowest-cost—and most overlooked—strategies for reducing desalination operating costs requires zero new equipment. It simply involves scheduling your production to align with the cheapest electricity tariffs.
The Concept
Most industrial electricity tariffs have time-of-use (TOU) structures: higher rates during peak daytime hours (when grid demand is high) and lower rates during off-peak nighttime hours (when demand drops). By storing produced freshwater in elevated tanks or reservoirs and running the desalination plant primarily during low-tariff periods, you capture the arbitrage between cheap nighttime power and expensive daytime power.
If electricity rates are 0.08/kWhoff−peakvs0.08/kWhoff−peakvs0.16/kWh peak, and you can shift 60% of production to off-peak hours, your blended energy cost drops to approximately $0.11/kWh—a 30% reduction in power OPEX.
Strategy #4 — Renewable Energy Integration
For remote or island applications—which are a core market for small- to medium-scale desalination—grid electricity may be expensive, unreliable, or unavailable. In these settings, integrating renewable energy is not just an environmental choice but an economic necessity.
Two Main Approaches
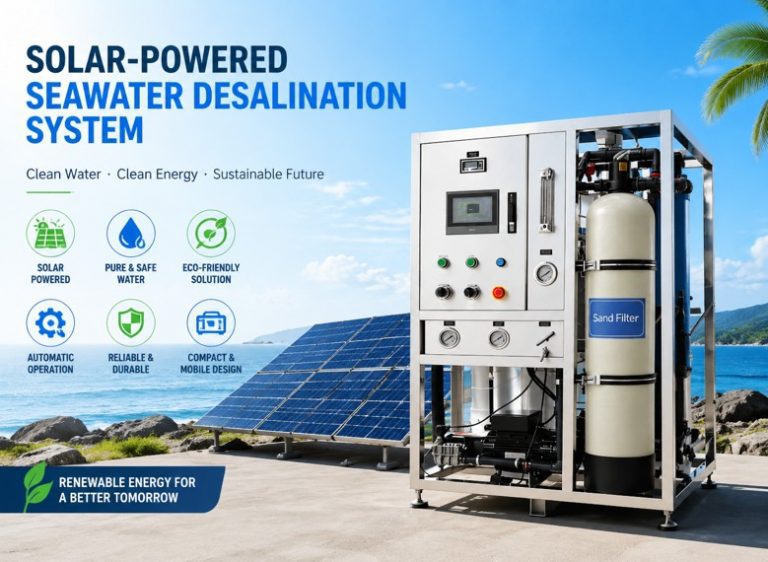
Solar-Powered SWRO: Photovoltaic panels directly power the desalination plant. Because desalination plants can be designed to modulate output based on available solar radiation (or use batteries for steady operation), solar-SWRO is well-established in many island and coastal regions.
Wind-Powered SWRO: For locations with consistent wind resources, wind turbines provide an excellent match. The combination of wind and solar (hybrid) is often the most reliable approach for island communities.
Wind-Solar Hybrid + Storage: An integrated system combining wind turbines, solar PV, and battery storage ensures 24/7 operation even when renewable sources fluctuate.
Strategy #5 — Chemical Optimization
Chemicals typically account for 8–15% of OPEX—but they also have significant indirect impacts on membrane lifespan and cleaning frequency. Poorly managed chemical dosing drives up costs in at least three ways.
The Three Cost Centers
-
Direct chemical purchases: Antiscalants, cleaning chemicals (acids, alkalis, detergents), biocides, and neutralizing agents all cost money.
-
Membrane replacement from over-dosing or wrong chemistry: Overdosing some antiscalants, particularly phosphonate-based products, can actually foul membranes rather than protect them. Under-dosing leads to scale formation that permanently damages membrane surfaces.
-
Labor and downtime for cleaning-in-place (CIP): Every CIP event requires plant shutdown (full or partial), specialized chemicals, skilled labor hours, and generates chemical waste for disposal
-
Strategy #6 — Smart Monitoring & Predictive Maintenance
Membrane fouling is the hidden cost driver in many desalination plants. Fouling increases differential pressure, which drives up energy consumption, requires more frequent cleaning, and shortens membrane lifespan. It has been estimated that fouling and aging membranes can drive up to 25% of RO plant OPEX.
However, traditional maintenance—cleaning on a fixed schedule or only when problems become obvious—is both inefficient and expensive. It often means cleaning too early (wasting chemicals and labor) or too late (allowing irreversible damage).
Better Approach: Real-time Fouling Monitoring & Predictive Cleaning
Modern real-time monitoring systems use in-situ fluorescence and UV-visible absorbance sensors to detect early-stage biological activity and organic fouling in feedwater before it accumulates on membranes. This enables true predictive maintenance.
- Cleaning-in-place (CIP) frequency reduced by 50%
Membrane replacement costs reduced by 20%
Pretreatment chemical usage reduced by 25%
Energy consumption reduced by 3% (by avoiding fouling-driven pressure increases)
- Strategy #7 — Optimized Maintenance & Membrane Replacement Strategy The previous strategy focused on monitoring. This one focuses on decision rules once you have the data. The Problem with Fixed Schedules Many plant operators use fixed-interval cleaning and membrane replacement schedules (e.g., “clean every 6 months, replace every 3 years”). This approach has two major flaws: It ignores actual water quality, feedwater temperature, and fouling conditions It leads to either premature replacement (wasting remaining useful life) or overdue replacement (running membranes in an inefficient, high-energy state) The Data-Driven Replacement Rule Normal seawater RO membranes have a typical lifespan of 3 to 5 years under good operating conditions, though many plants see 2 to 4 years in practice. However, calendar time is not the right metric. The correct metric is performance economics:
- Track specific energy consumption (kWh/m³) over time. When SEC rises by 15–20% above the baseline established when membranes were new—and the increase is confirmed to come from membrane degradation rather than other factors (feed temperature drop, pump wear, etc.)—it is time to evaluate replacement.
Monitor salt rejection. If salt passage increases beyond acceptable limits for your product water quality standard, replace regardless of SEC change.
Track cleaning frequency. When membranes require cleaning more than once every 3–4 months, replacement may be more economical than continuing to clean.
-
Summary of Savings Potential
-
The strategies outlined above are not theoretical. They are being deployed in real SWRO plants worldwide. Combined, they can produce cumulative savings of 40% to 60% in overall OPEX.
Summary Table: Expected Savings by Strategy
Strategy Typical OPEX Reduction Payback / Implementation Difficulty Energy Recovery Device (ERD) 30%–50% on energy (16%–30% total OPEX) Medium CAPEX, short payback (1–3 years) Low-Energy SWRO Membranes 10%–20% on energy (5%–10% total OPEX) Low CAPEX premium, immediate payback Operational (Tariff) Scheduling Up to 35% on energy Zero CAPEX if storage exists Renewable Energy Integration 15%–20% total OPEX High CAPEX, payback depends on local resources Chemical Optimization 20%–50% on chemical spend (2%–7% total OPEX) Low CAPEX, immediate Smart Monitoring & Predictive CIP 3% on energy + 50% on CIP costs + 20% on membranes Low-to-medium CAPEX, very short payback (2–12 months) Optimized Replacement Strategy 10%–20% on membrane spend Zero CAPEX, best-practice operational change Chapter 10: How Factory Direct Supply Fits Into the Cost Equation
As a direct factory supplier, we offer two additional OPEX advantages that are often overlooked.
No Middleman Markups on Spare Parts and Consumables
When you buy from a distributor or international brand name, you pay a significant markup not only on the original equipment but also on every spare part, membrane, chemical consumable, and replacement component over the entire 20-year life of the system. When you purchase factory direct, you eliminate those markups entirely. For a plant with high membrane and chemical consumption, the cumulative savings over a decade can approach the initial equipment cost.
Avoiding Brand Premium Without Compromising Quality
Our role as your partner: We do not just sell equipment. We provide site-specific OPEX reduction recommendations for every unit we supply, from 3-ton/day compact systems to 1,000-ton/day project-scale plants. Before you order, we can model your expected energy consumption, chemical usage, and membrane replacement intervals based on your local seawater quality and operating pattern. After installation, we provide ongoing technical support to help you sustain low OPEX year after year.
Conclusion: Start Reducing OPEX Today
The era of accepting high operating costs as an unavoidable reality of seawater desalination is over. With the right combination of technology—energy recovery devices, low-energy membranes, smart monitoring, chemical optimization, and renewable integration—desalination can be economically viable even in small- to medium-scale applications.
The key question for your next desalination project is not whether OPEX can be reduced. It is: Which combination of strategies fits your specific water source, location, electricity costs, and production target?
We invite you to contact our technical team for a customized OPEX reduction analysis for your project. Tell us your target capacity (3 to 1,000+ tons/day), feedwater source (seawater, brackish water, or high-TDS), local electricity cost ($/kWh), and operating hours per day. We will provide:
-
A recommended equipment configuration optimized for your local conditions
-
A projected energy consumption estimate (kWh/m³)
-
A membrane replacement and chemical consumption forecast for the first 5 years
-
A total lifecycle cost summary comparing multiple configuration optionsWe are a direct seawater desalination factory. No distributors. No unnecessary markups. Just reliable equipment and honest, data-backed advice to minimize your long-term operating costs.Contact us today with your project details for a free, no-obligation OPEX reduction analysis.
-